

Bybit vs OKX Fees: Compare Your Actual Trading Cost

Is a 0.005 percentage-point fee gap worth switching exchanges for? If you're comparing Bybit and OKX, start with your trades, not a ranking.
A lower advertised rate can look decisive until you put a dollar amount beside it. Your order size, execution method, and account rate matter. So does the cost of getting the trade filled.
This guide separates published rates from illustrative rates, then compares identical trading scenarios. It doesn't declare a universal winner.
Rates checked October 6, 2026. All calculations below are illustrations, not estimates of your personal bill. USDT amounts aren't a guarantee of dollar value.
The short answer
- Compare the same product, trading pair, account tier, and total executed volume.
- For the sample linear-futures taker rates below, 100,000 USDT of total fills costs 55 USDT versus 50 USDT.
- That 5 USDT difference excludes funding and execution costs.
- Your logged-in fee schedule decides whether those sample rates actually apply.
The useful question isn't simply which exchange has the lower number. It's how much that difference would change your own cost, under comparable conditions.
Think of it like comparing delivery prices: the listed charge isn't useful without the size and timing of your actual order.
What rates are we comparing?
Bybit's published VIP 0 schedule lists ordinary crypto-to-crypto spot fees of 0.10% maker and taker. Its perpetual and futures rates are 0.02% maker and 0.055% taker. Account and regional conditions can differ. Bybit fee schedule.
OKX's official worked examples use 0.08% maker and 0.10% taker for spot, plus 0.02% maker and 0.05% taker for USDT futures. These are example inputs, not verified universal account rates. Check your logged-in schedule. OKX fee FAQ.
That distinction matters. We're comparing the arithmetic of two stated rate sets, not claiming every new customer receives them. Don't turn an example into a promise.
Spot means buying or selling the asset itself. A futures contract gives you price exposure; a perpetual is a contract without a fixed expiry.
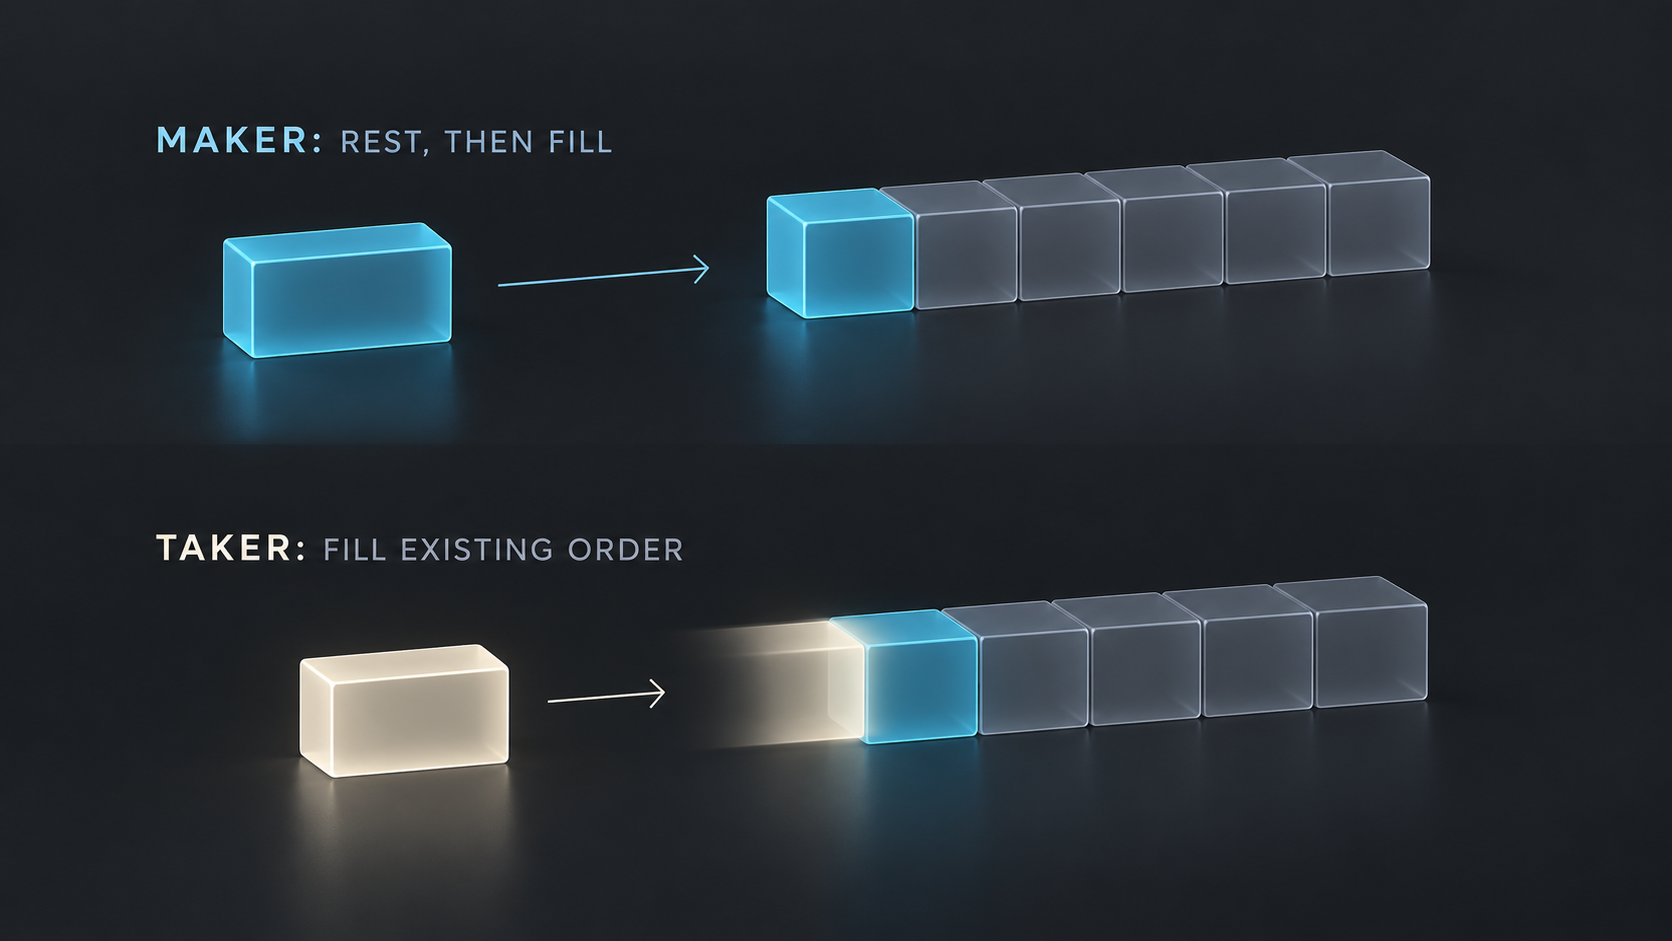
Maker fills add resting orders to the book. Taker fills execute against orders already there. USDT is a dollar-linked token, not a bank dollar.
Before using the numbers, write down your actual maker and taker rates for the exact pair you're considering. Keep a dated screenshot for your own records.
Also check whether you're comparing ordinary spot trading with another spot product. A spot rate and a perpetual-contract rate answer different questions.
How much is the difference on one trade?
Take a hypothetical 10,000 USDT linear-futures fill. Assume it's entirely taker execution and both sample rates apply.
- At 0.055%: 10,000 × 0.00055 = 5.50 USDT.
- At 0.05%: 10,000 × 0.0005 = 5 USDT.
- Difference: 0.50 USDT for that fill.
That's one execution, not a complete round trip. If you later close at another 10,000 USDT of notional, the combined cost becomes 11 versus 10 USDT.
We held the closing notional constant to isolate the fee difference. A real exit price may differ, changing the amount used in the calculation.
For linear USDT contracts, Bybit expresses trading fees using executed quantity, executed price, and the applicable rate. Inverse contracts use a different formula. Bybit futures fee explanation.
Notional means the full value of the position; margin is the collateral supporting it. Leverage increases exposure relative to that collateral.
Keep leverage out of this multiplication once you've already entered the full notional. Multiplying a 10,000 USDT position by leverage again would overstate the fee.
What does that become over a month?
Assume 100,000 USDT of total executed linear-futures volume, including entries and exits. Treat every fill as taker and keep the rate constant.
The sample Bybit calculation is 100,000 × 0.00055 = 55 USDT. The sample OKX calculation is 100,000 × 0.0005 = 50 USDT.
At 1,000,000 USDT of total fills, the same arithmetic gives 550 versus 500 USDT. That isn't a forecast of your activity or a reason to trade more.
The rate gap is 0.005 percentage points, or half a basis point. One basis point is 0.01 percentage points. It isn't a 0.005% reduction in the size of the fee itself.
Using 55 as the starting bill, a reduction to 50 is about 9.09%. Both descriptions can be mathematically correct, but they use different denominators.
For practical comparison, the absolute amount is often easier to interpret. You can weigh 5 USDT against other differences without being distracted by a percentage headline.
What if some fills are maker?
Suppose your 100,000 USDT monthly total consists of 40,000 maker volume and 60,000 taker volume. This is a volume split, not an order-count split.
Using the sample Bybit rates, maker fees are 8 USDT and taker fees are 33 USDT. Total: 41 USDT.
Using the sample OKX rates, maker fees are 8 USDT and taker fees are 30 USDT. Total: 38 USDT.
The difference is now 3 USDT. Using the taker-only comparison would have overstated it for this particular mix.
You can calculate a weighted rate by dividing total fees by total executed value. Here, the weighted rates are 0.041% and 0.038%.
Don't average the two headline rates unless maker and taker volume are equal. One large taker fill can outweigh dozens of small maker fills.
And don't assume pressing the limit-order button guarantees the maker rate. Execution determines the classification. OKX fee FAQ.
Can post-only solve the problem?
Bybit's post-only setting cancels an order that would immediately execute instead of resting in the book. That helps control execution classification, not fill certainty. Bybit post-only documentation.
Imagine you're trying to exit during a fast move. A canceled order leaves you exposed, even if its intended maker fee looked attractive.
That's why maker and taker shouldn't be treated as good and bad labels. They describe different ways to execute, with different trade-offs.
If a strategy requires immediate execution, compare its realistic taker cost. Don't model a hypothetical maker fill just to make the backtest cheaper.
If your strategy can wait, measure how often resting orders actually fill. Include canceled orders and missed trades when evaluating the strategy, without inventing a fee for them.
Does the spot comparison tell a different story?
It can. At the stated sample spot rates, 100,000 USDT-equivalent of all-taker turnover produces a 100 USDT-equivalent fee on either side.
For all-maker turnover of the same size, the arithmetic becomes 100 versus 80 USDT-equivalent. Again, the OKX input is illustrative, not an account quote.
These are value-normalized comparisons. A spot fee may be charged in an asset rather than your reporting currency, so don't add unlike units together.
Choose a consistent valuation convention when reviewing your records. For example, value each asset-denominated charge using its recorded execution price where applicable.
Keep the original fee asset and amount as well. Otherwise, later price changes can make an old fee seem larger or smaller than it was when paid.
The wider lesson is simple: a venue can look cheaper for one execution pattern and effectively equal for another. Your actual pattern is the relevant one.
What belongs outside the trading-fee comparison?
Separate explicit trading fees from execution quality. A useful worksheet has different columns for commission, funding, and your chosen execution benchmark.
Spread is the gap between quoted buying and selling prices. Slippage is the difference between your reference price and actual execution price.
For perpetuals, funding can be paid or received, depending on the rate and position direction. Timing and intervals are contract-specific. Bybit funding explanation.
For an illustrative comparison, suppose one venue saves you 5 USDT in commission. If measured execution costs are 12 USDT higher, the combined difference is 7 USDT worse.
Those amounts are invented to demonstrate the comparison method. They aren't observations about either exchange's liquidity or execution quality.
Use comparable timestamps, pairs, sizes, and benchmarks before drawing a conclusion. Comparing yesterday's calm market with today's volatile one won't isolate the venue's effect.
Also avoid counting spread twice. A price-based execution benchmark may already include the effect you planned to record separately as spread.
How should you compare your own accounts?
Start with a fixed period, such as your last complete calendar month. Use the same timezone and scope for both sets of records.
Record the product, pair, fee tier, executed value, maker or taker classification, charged fee, and fee currency. Include a timestamp for every fill.
Then calculate your observed commission rate: total comparable fees divided by total comparable executed value. This is a historical measurement, not tomorrow's guaranteed rate.
Next, price that same volume and maker/taker mix using the other account's applicable schedule. Label the result a scenario, because execution may differ after switching.
Keep funding and other charges in separate lines. Record actual credits separately from advertised benefits, especially when eligibility or payment timing is conditional.
Finally, consider whether the product is available to you and suitable for your circumstances. Fees alone don't establish access, safety, or suitability.
Three mistakes that can reverse the result
Doubling volume twice. If your export already includes entries and exits, you don't multiply the monthly total by two again.
Using balance instead of turnover. A 2,000 USDT balance doesn't tell you whether you executed 2,000 or 200,000 USDT during the period.
Comparing different assumptions. A discounted maker rate on one account shouldn't be compared with an undiscounted taker rate on another as though they're equivalent.
It's also worth checking the time period behind a screenshot. A previous tier, promotion, or account setting may not describe your next trade.
So which one should you choose?
There isn't a defensible universal winner from these numbers alone. Under the sample all-taker futures scenario, the difference is 5 USDT per 100,000 USDT of fills.
Under a different account schedule or execution mix, the answer changes. Your decision should follow the conditions you can verify, not an assumed discount.
Start by measuring one month accurately. For a step-by-step worksheet, read our guide to calculating your crypto trading fees.
You can also review the applicable fee-reduction conditions on TradeBoost before changing how you trade.
This article is published by TradeBoost and contains no exchange referral links. It's for informational purposes only, not financial advice or an exchange recommendation. Trading decisions and risks remain yours.
What TradeBoost is
TradeBoost is a third-party affiliate-rebate service that returns a portion of exchange affiliate commissions to users as USDT on Arbitrum One. TradeBoost is not an exchange, broker, custodian, or investment service, and does not provide trading, custody, or financial advice.
General disclaimer
This article is for informational purposes only. All trading occurs on third-party exchanges under their terms. Trading and investment decisions should be made based on your own judgment and risk tolerance.