
Bitcoin Near $65,000: Buy the Dip or Wait?
Table of contents
When Bitcoin came back near $65,000, it raised an awkward question. Was the selloff offering a better entry, or was the bounce about to fade?
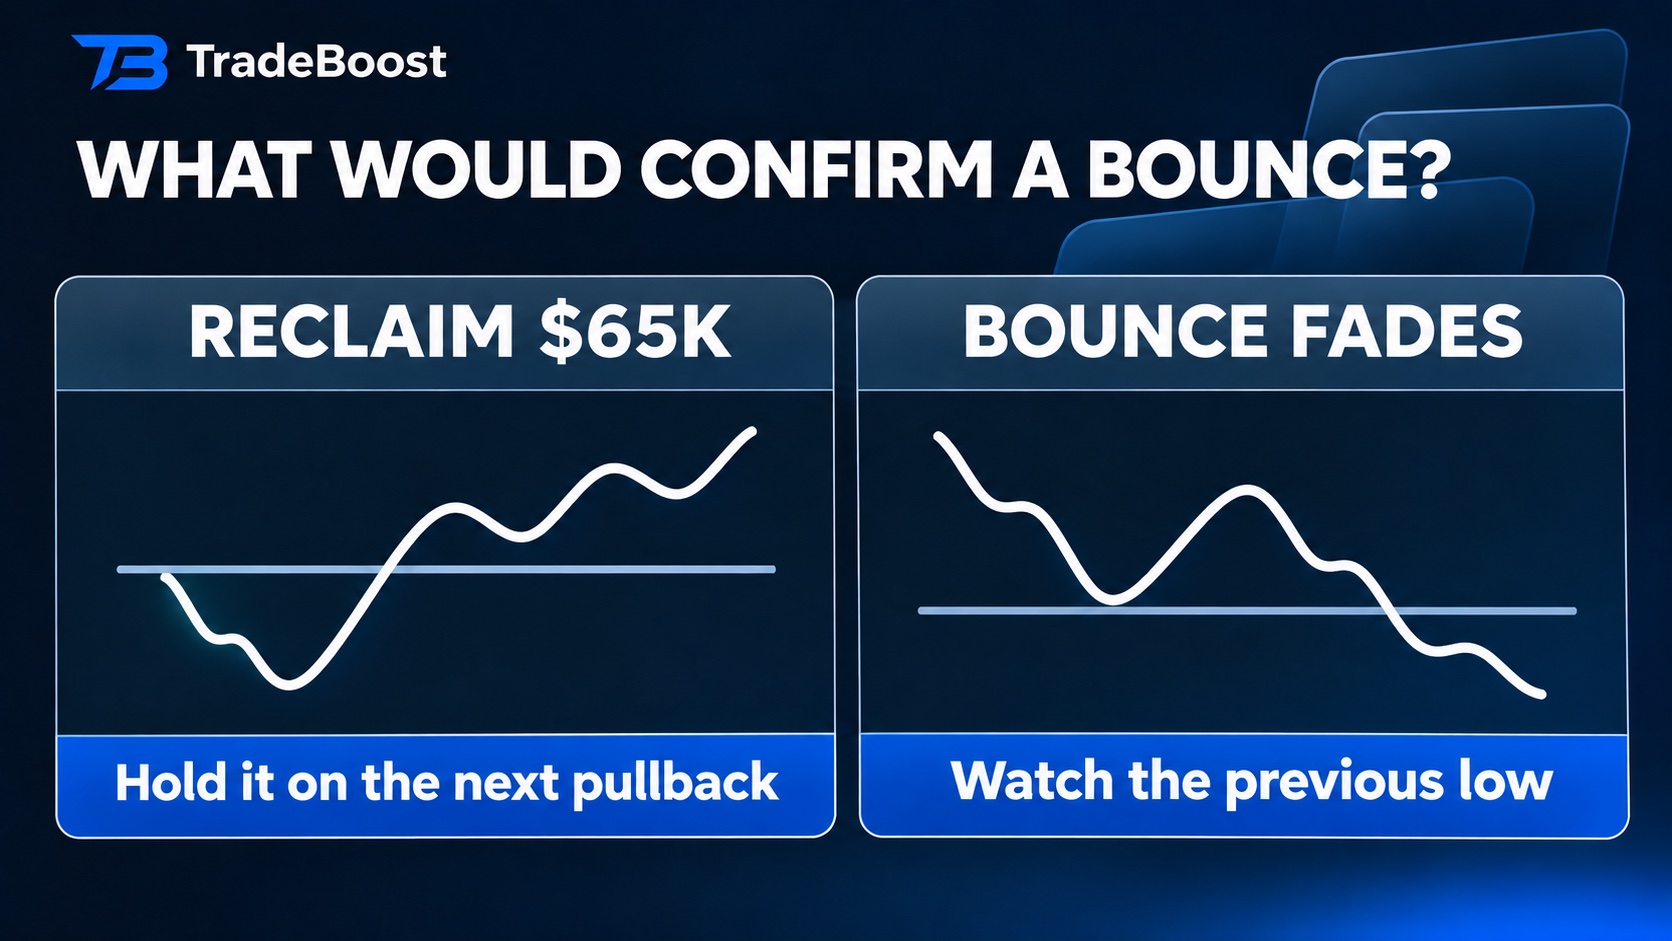
✅ If you're waiting for evidence of a bottom, watch whether Bitcoin can reclaim $65,000 and hold it on the next pullback. A bounce that stalls below that level and gives way to a fresh low is a reason to keep waiting. The next completed U.S. spot ETF flow report gives you a second check.
What happened around $65,000? 🔎
At 12:14 UTC on November 16, Binance reported a move below 64,000 USDT. Its BTC/USD price page showed around $64,945 at 17:40 UTC that day. Those snapshots use different quote currencies and different times. Treat them as a picture of the range Bitcoin was trading in. Binance market update · BTC/USD price page
Say you're watching $65,000. A move above the line tells you where a trade took place. A daily close above it, followed by a pullback that holds, gives you two observations about whether buyers are staying around. Use the same venue and quote currency for both checks.
How much left Bitcoin ETFs last week? 📊
A spot Bitcoin ETF gives investors exposure to Bitcoin through a brokerage account. Net flow measures money coming into a group of funds after subtracting money leaving. Here's Farside's U.S. spot Bitcoin ETF table for November 9–13.
| U.S. trading date | Net flow |
|---|---|
| Nov. 9 | −$201.0M |
| Nov. 10 | −$95.0M |
| Nov. 11 | −$299.8M |
| Nov. 12 | −$284.1M |
| Nov. 13 | −$185.4M |
| Total | −$1,065.3M |
That's roughly $1.07 billion in net outflows. Crypto trades on weekends and these funds follow a U.S. trading calendar. Pair each flow row with its trading date, and give incomplete rows time to fill in. An ETF flow tells you about activity in those funds. Bitcoin also trades on exchanges and through desks outside that group.
What would settle the buy-or-wait question? ✍️
- Watch the close. Check whether BTC/USD closes above $65,000 using the same exchange and quote currency.
- Watch the next pullback. See if buyers show up around that level. If the bounce fades, see whether the prior low holds.
- Check completed ETF flows. See if outflows are shrinking and how price reacted over the same window. Wait for complete rows before comparing days.
That gives you a way to update your view even if the next candle moves fast. A recovered level tells you more once the market comes back to test it.
Market prices are snapshots. This article is informational, and trading can result in losses.
What TradeBoost is
TradeBoost is a third-party affiliate-rebate service that returns a portion of exchange affiliate commissions to users as USDT on Arbitrum One. TradeBoost is not an exchange, broker, custodian, or investment service, and does not provide trading, custody, or financial advice.
General disclaimer
This article is for informational purposes only. All trading occurs on third-party exchanges under their terms. Trading and investment decisions should be made based on your own judgment and risk tolerance.
Related articles
 market-updates
Nvidia Earnings: Could Bitcoin Move After the Report?
See when Nvidia reports and when Fed minutes are released, plus what Bitcoin, Nasdaq futures and Treasury yields can tell you afterward.
 market-updates
Binance Asset Seizure: Can You Still Withdraw?
A U.S. seizure announcement drew attention to Binance. Here's how to separate what the order covers from the withdrawal status in your account.
 exchange-guides
Bitget’s Two 20% Fee Discounts: Which One Applies?
Bitget’s BGB spot fee discount and TradeBoost’s 20% referral offer cover different trades. See who qualifies and what to check before signup.